
12 KiB
Pentesting Kubernetes Services
{{#include ../../../banners/hacktricks-training.md}}
Kubernetes uses several specific network services that you might find exposed to the Internet or in an internal network once you have compromised one pod.
Finding exposed pods with OSINT
One way could be searching for Identity LIKE "k8s.%.com" in crt.sh to find subdomains related to kubernetes. Another way might be to search "k8s.%.com" in github and search for YAML files containing the string.
Useful external recon signals to correlate before scanning:
- DNS and certificate transparency names containing
k8s,kube,api,apiserver,eks,gke,aks,cluster,ingress,argocd,grafana,prometheus,harbor,registry,dashboard,dev,stage, or region names. - Cloud load balancer names, CNAMEs, tags, and provider hostnames that can link an exposed application or platform UI back to a cluster.
- Public repositories, CI logs, Helm values, Terraform state, rendered manifests, container images, and documentation leaking kubeconfigs, API server URLs, namespaces, service accounts,
type: LoadBalancer,type: NodePort, Ingress hosts, Gateway listeners, or dashboard settings. - Managed Kubernetes inventory, when cloud credentials are in scope: EKS endpoint public/private access and public CIDRs, GKE public/private control-plane settings and authorized networks, and AKS private cluster/API server authorized IP settings.
- Exposed platform tools around the cluster such as Argo CD, Prometheus, Grafana, Harbor, registries, CI/CD dashboards, service mesh dashboards, and ingress-controller admin or metrics endpoints.
Treat these as attribution and prioritization clues. A public Ingress application is normal in many clusters, while exposed kubelet, etcd, dashboard, CI/CD deploy control, or leaked kubeconfig material should be prioritized much higher.
How Kubernetes Exposes Services
It might be useful for you to understand how Kubernetes can expose services publicly in order to find them:
{{#ref}} ../exposing-services-in-kubernetes.md {{#endref}}
Finding Exposed pods via port scanning
The following ports might be open in a Kubernetes cluster:
| Port | Process | Description |
|---|---|---|
| 443/TCP | kube-apiserver | Kubernetes API port |
| 2379/TCP | etcd | |
| 6666/TCP | etcd | etcd |
| 4194/TCP | cAdvisor | Container metrics |
| 6443/TCP | kube-apiserver | Kubernetes API port |
| 8443/TCP | kube-apiserver | Minikube API port |
| 8080/TCP | kube-apiserver | Insecure API port |
| 10250/TCP | kubelet | HTTPS API which allows full mode access |
| 10255/TCP | kubelet | Unauthenticated read-only HTTP port: pods, running pods and node state |
| 10256/TCP | kube-proxy | Kube Proxy health check server |
| 9099/TCP | calico-felix | Health check server for Calico |
| 6782-4/TCP | weave | Metrics and endpoints |
| 30000-32767/TCP | NodePort | Proxy to the services |
| 44134/TCP | Tiller | Helm service listening |
Nmap
nmap -n -T4 -p 443,2379,6666,4194,6443,8443,8080,10250,10255,10256,9099,6782-6784,30000-32767,44134 <pod_ipaddress>/16
Kube-apiserver
This is the API Kubernetes service the administrators talks with usually using the tool kubectl.
Common ports: 6443 and 443, but also 8443 in minikube and 8080 as insecure.
curl -k https://<IP Address>:(8|6)443/swaggerapi
curl -k https://<IP Address>:(8|6)443/healthz
curl -k https://<IP Address>:(8|6)443/api/v1
Check the following page to learn how to obtain sensitive data and perform sensitive actions talking to this service:
{{#ref}} ../kubernetes-enumeration.md {{#endref}}
Kubelet API
This service run in every node of the cluster. It's the service that will control the pods inside the node. It talks with the kube-apiserver.
If you find this service exposed you might have found an unauthenticated RCE.
Kubelet API
curl -k https://<IP address>:10250/metrics
curl -k https://<IP address>:10250/pods
If the response is Unauthorized then it requires authentication.
If you can list nodes you can get a list of kubelets endpoints with:
kubectl get nodes -o custom-columns='IP:.status.addresses[0].address,KUBELET_PORT:.status.daemonEndpoints.kubeletEndpoint.Port' | grep -v KUBELET_PORT | while IFS='' read -r node; do
    ip=$(echo $node | awk '{print $1}')
    port=$(echo $node | awk '{print $2}')
    echo "curl -k --max-time 30 https://$ip:$port/pods"
    echo "curl -k --max-time 30 https://$ip:2379/version" #Check  also for etcd
done
kubelet (Read only)
curl -k https://<IP Address>:10255
http://<external-IP>:10255/pods
etcd API
curl -k https://<IP address>:2379
curl -k https://<IP address>:2379/version
etcdctl --endpoints=http://<MASTER-IP>:2379 get / --prefix --keys-only
Tiller
helm --host tiller-deploy.kube-system:44134 version
You could abuse this service to escalate privileges inside Kubernetes:
cAdvisor
Service useful to gather metrics.
curl -k https://<IP Address>:4194
NodePort
When a port is exposed in all the nodes via a NodePort, the same port is opened in all the nodes proxifying the traffic into the declared Service. By default this port will be in in the range 30000-32767. So new unchecked services might be accessible through those ports.
sudo nmap -sS -p 30000-32767 <IP>
Service mesh and proxy surfaces
Clusters using Istio, Linkerd, Cilium service mesh, or Envoy-based gateways add another service layer to enumerate. A mesh can provide mTLS, workload identity, L7 routing, authorization policy, telemetry, and gateway/egress controls, but it only protects traffic that is actually enrolled and intercepted by the mesh.
Useful checks from Kubernetes access:
kubectl get ns --show-labels | egrep 'istio|linkerd|mesh|cilium'
kubectl get crd | egrep 'istio.io|linkerd.io|gateway.networking.k8s.io|cilium.io'
kubectl get mutatingwebhookconfiguration,validatingwebhookconfiguration | egrep 'istio|linkerd|cilium'
kubectl get pods -A -o custom-columns='NS:.metadata.namespace,NAME:.metadata.name,SA:.spec.serviceAccountName,CONTAINERS:.spec.containers[*].name'
kubectl get svc -A | egrep 'istio|envoy|linkerd|kiali|jaeger|prometheus|grafana|zipkin|hubble'
Review:
- Namespaces or workloads that opted out of injection, still run without a proxy, or were created before injection was enabled.
- mTLS mode. Permissive migration modes may still accept plaintext from unmeshed sources.
- Istio
PeerAuthentication,AuthorizationPolicy,RequestAuthentication, gateways, waypoints, and egress resources. - Linkerd policy resources, identity, Server/authorization objects, and exposed
linkerd-viz, tap, or metrics surfaces. - Cilium service mesh and Gateway API resources, Hubble visibility, Cilium policies, and Envoy integration points.
- Envoy admin, config dump, stats, metrics, tracing, dashboard, and debug endpoints. These can leak routes, upstreams, certificates, identity, and traffic state if exposed too broadly.
Do not treat service mesh as a replacement for Kubernetes RBAC or NetworkPolicies. A mesh policy can block an HTTP request while an unmeshed Pod, skipped port, direct Pod IP path, gateway, egress proxy, or missing NetworkPolicy still leaves a practical route.
Vulnerable Misconfigurations
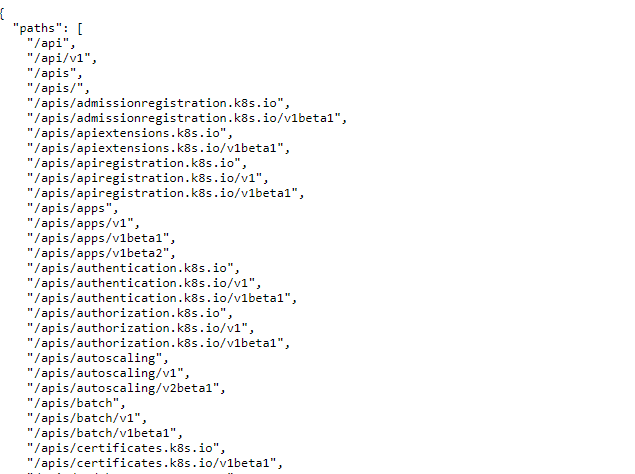
Kube-apiserver Anonymous Access
Anonymous access to kube-apiserver API endpoints is not allowed. But you could check some endpoints:
Checking for ETCD Anonymous Access
The ETCD stores the cluster secrets, configuration files and more sensitive data. By default, the ETCD cannot be accessed anonymously, but it always good to check.
If the ETCD can be accessed anonymously, you may need to use the etcdctl tool. The following command will get all the keys stored:
etcdctl --endpoints=http://<MASTER-IP>:2379 get / --prefix --keys-only
Kubelet RCE
The Kubelet documentation explains that by default anonymous access to the service is allowed:
Enables anonymous requests to the Kubelet server. Requests that are not rejected by another authentication method are treated as anonymous requests. Anonymous requests have a username of
system:anonymous, and a group name ofsystem:unauthenticated
To understand better how the authentication and authorization of the Kubelet API works check this page:
{{#ref}} kubelet-authentication-and-authorization.md {{#endref}}
The Kubelet service API is not documented, but the source code can be found here and finding the exposed endpoints is as easy as running:
curl -s https://raw.githubusercontent.com/kubernetes/kubernetes/master/pkg/kubelet/server/server.go | grep 'Path("/'

Path("/pods").
Path("/run")
Path("/exec")
Path("/attach")
Path("/portForward")
Path("/containerLogs")
Path("/runningpods/").
All of them sound interesting.
You can use the Kubeletctl tool to interact with Kubelets and their endpoints.
/pods
This endpoint list pods and their containers:
kubeletctl pods
/exec
This endpoint allows to execute code inside any container very easily:
kubeletctl exec [command]
Note
To avoid this attack the kubelet service should be run with
--anonymous-auth falseand the service should be segregated at the network level.
Checking Kubelet (Read Only Port) Information Exposure
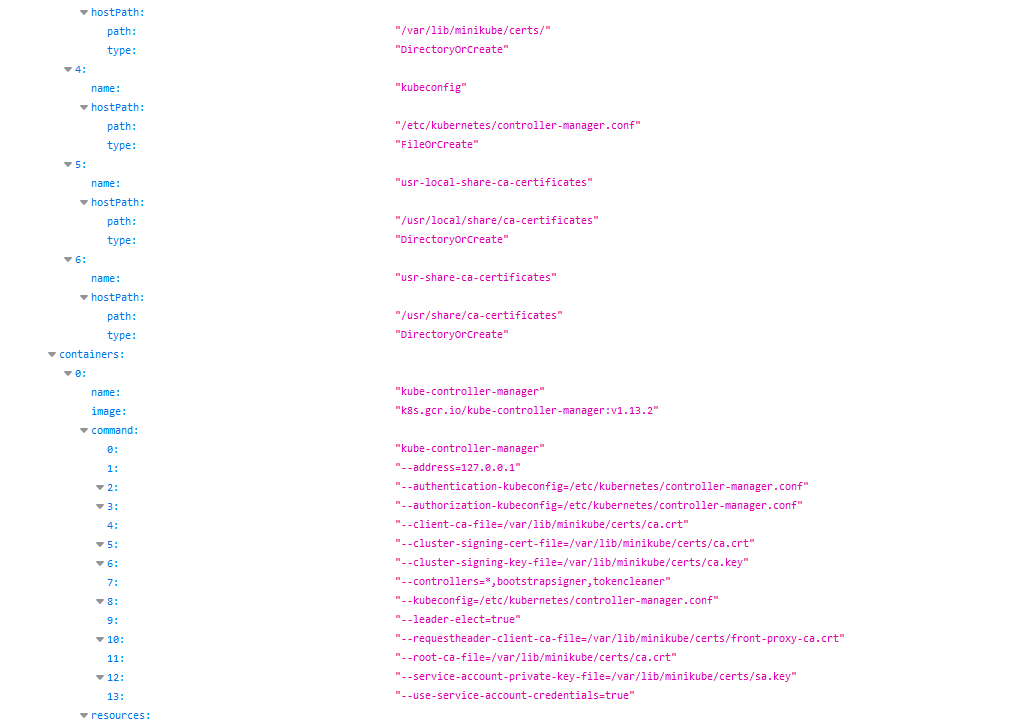
When a kubelet read-only port is exposed, it becomes possible for information to be retrieved from the API by unauthorized parties. The exposure of this port may lead to the disclosure of various cluster configuration elements. Although the information, including pod names, locations of internal files, and other configurations, may not be critical, its exposure still poses a security risk and should be avoided.
An example of how this vulnerability can be exploited involves a remote attacker accessing a specific URL. By navigating to http://<external-IP>:10255/pods, the attacker can potentially retrieve sensitive information from the kubelet:
References
{{#ref}} https://www.cyberark.com/resources/threat-research-blog/kubernetes-pentest-methodology-part-2 {{#endref}}
{{#ref}} https://labs.f-secure.com/blog/attacking-kubernetes-through-kubelet {{#endref}}
{{#include ../../../banners/hacktricks-training.md}}